
Transferring PLATIT's ALL4 coating to much smaller tools with GfE

The Customer
The customer is GFE - Gesellschaft für Fertigungstechnik und Entwicklung Schmalkalden e.V. It is an industry-oriented research institution offering complete solutions for tools. GFE acts as a research and development partner for medium- and large-sized German companies.
The customer uses several PLATIT hybrid arc and sputter coating machines to grow high-quality hard coatings on normal milling and drilling tools. The customer is also proficient in material characterization and performance testing of various coated instruments.
The end-user of this study is a commercial company, whose identity is not disclosed within this case study.
Problem Specification
Even though the Customer's coating recipes are state-of-the art and finely optimized, their performance and quality may change when transferred to a radically different form factor of the coated part.
In this case, PlasmaSolve's job was to predict the change in the performance of coating recipes when transferring them from normal-sized tools to so-called micro-tools. The challenge related to micro-tools is that most characterization instruments fail to measure them or do not measure them accurately.
A conventional approach to this problem would require a DoE-matrix and extensive trial-and-error while simulation represents a more modern approach.
Results and Benefits
PlasmaSolve's simulations helped the Customer to
-
De-risk the process transfer to an entirely new part.
-
Reach variation in coating composition below 2%
-
Optimize coating distribution around sharp cutting edges.
-
Reduce lateral coating non-uniformity by ca 20% through adjusting the fixtures.
For PlasmaSolve, the project yielded another solid validation for their simulation software - specifically the component for predicting coating thickness and composition on complex 3D parts.
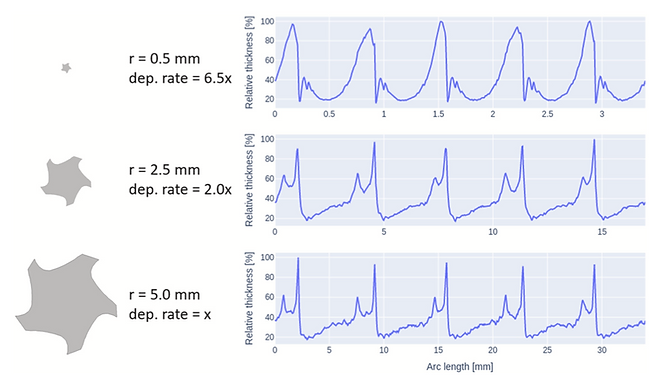
When the size of the coated tool changes, the coating distribution changes, as well as the absolute-valued deposition rate.
Simulation Strategy
The study used PlasmaSolve's particle-based simulation code for predicting film thickness and composition on real 3D parts.
The code calculates trajectories of effective particles (neutral metal vapors, singly-ionized and multiple-ionized ions) in the proximity of the coated part and allows the particles to stick at surfaces, forming the coating.
Since different particles respond differently to collisions with the neutral gas and to the electric field in the sheath near the part, there are typically variations in coating composition near the cutting edges of the tool. This too, can be resolved with the simulation tool.
Finally, the coated tool undergoes 3-axis rotation in the actual coating machine. The simulation takes into account this rotation by combining a sequence of simulations with different rotation angles of the coated tool.
The simulation also takes into account the presence of other coating tools and the nearby fixtures (top plate).
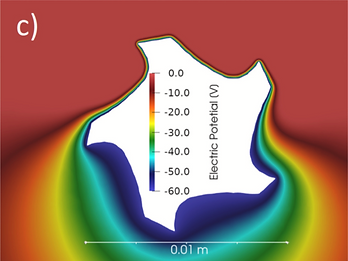
The top section of the tool is facing the cathode plasma, which is why the sheath is thinner there. In the actual simulation, the tool rotates and the sheath changes over time.
The computational mesh is adaptive and it can resolve both large scale features (±1 cm) and cutting edges (±50 um radius)
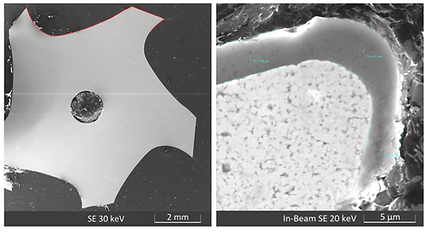
SEM cross-section of a milling tool used for thickness measurement.
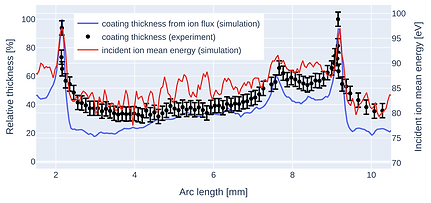
Coating thickness in an arc process correlates with the simulated ion flux and ion energy flux. In sputtering, these would be neutral metal atoms.
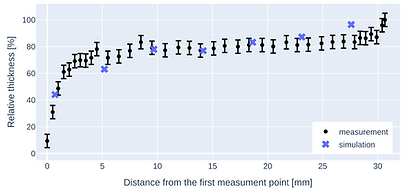
Vertical thickness following the cutting edge. At z=0, the tool is mounted in the fixure, z=32 corresponds to the tip of the tool.
Model validation
The model was validated against experimental thickness measurements with high spatial resolution. For practical reasons, the validation was performed on a normal-sized milling tool.
Along the circumference of the coating tool, we used SEM imaging to quantify the thickness evolution. The tool is first cast in epoxy, then cut in half and the transversal surface is polished. SEM imaging is then used to read out the thickness at various locations. The technique causes some damage to the coating but luckily, it remains mostly intact.
In the vertical direction, the thickness was measured on the flank of the tool in the vicinity of the cutting edge using X-ray. The variation is not so dramatic but we do see increase of coating thickness near the tip of the coating, which is a consequence of the antenna effect - more ions are attracted to the tip. The thickness is lower at the tool shank because of the fixture, in which the milling tool is mounted.
In an arc coating process, metal ions are make the largest contribution to the coating mass. That is why we usually see a very good corellation of ion flux and coating thickness. However, the mean ion impact energy also varies along the surface of the tool, leading to densification of the coating or even re-sputtering. That is why we also consider the mean ion energy, when making predictions about the coating thickness distribution.
The validation we performed was a success and gave us even higher confidence when extrapolating the model to the micro-tools later on.
Effect of part size on thickness uniformity
As mentioned in the introduction, the main objective of the project was to visualize, how the coating distribution changes when the size of the part changes significantly. This information is not easily attainable using diagnostic techniques as the coated tools get smaller.
To demonstrate the effect without revealing sensitive micro-tool geometries, we performed simulations on the milling tool, which was scaled down to 50% and 10% of the original radius. We note that:
-
The thickness distribution smoothes out when the tool gets smaller - this is because the plasma sheath thickness becomes the same as the characteristic dimension of the tool.
-
The deposition rate increases at smaller tools - this is perhaps not surprising because we used smaller tools with the same coater loading, so the tool can collect more mass onto it.
-
There is no simple correlation between the part radius or surface area and the deposition rate - this suggests a non-linear relation of these quantities and justifies the use of the model.

Measured atomic composition of the investigated coatings plotted against the predictions from the trained Digital Twin Model

The top chart shows how the coating thickness changes along the circumference of the tool. The bottom chart shows how the atomic composition deviates from the average and that there is over-concentration of aluminum on the cutting edge.
Composition non-uniformity on cutting edges
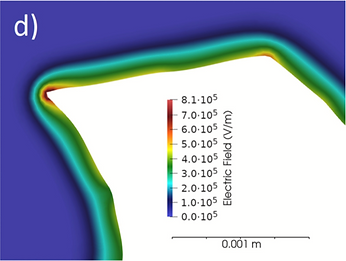
An interesting feature of coating techniques relying on deposition from ions is the fact that ions of different masses respond differently to the electric fields surrounding the complex coated parts.
This gives rise to the fact that the local atomic composition of the coating is sensitive to the geometry of the coated tool. Because aluminum is lighter, it is easier to be attracted by the sharp edges of the milling tool. Consequently, the aluminum content at the cutting edge of real tools will be different from aluminum content measured at the flank or aluminum content measured on probe plaques.
This effect is of minor importance in many cases but for highly optimized coatings, the 1% change in Al content could cause a hardness change of 2-3 GPa.
Controlling the lateral thickness using a top plate
It was shown above that the lateral thickness is non-uniform - the deposition rate is higher towards the tip of the milling tool.
This is potentially detrimental to the coating performance because too high thickness at the tip of the tool will cause effective dulling of the cutting edges.
A simple way of mitigating the effect is using a top-plate as a fixture. Simulations helped with finding the optimum location for the position of the top-plate.
The image to the left illustrates that the thickness distribution in the lateral slice is unaffected by the top plate, except for the tip of the drill bit.

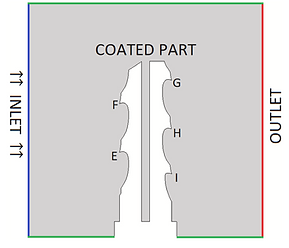
The geometry of the milling tool and a 2D lateral slice through it.
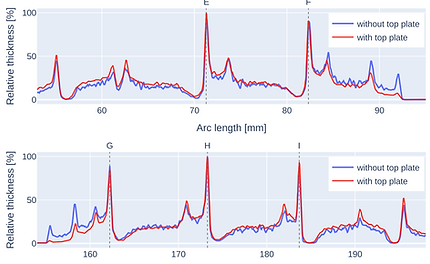
The top plate influences only thickness between points F-G, i.e. near the tip of the tool. The exact positioning of the top plate is crucial (5 mm above coated tool in this case)